Example 3: Phase Entropy w/ Pioncare Plot
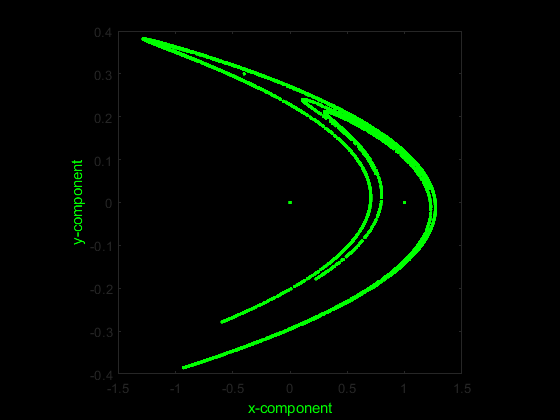
Import the x and y components of the Henon system of equations.
from matplotlib.pyplot import figure, plot, axis

Data = EH.ExampleData('henon');

fig = figure(facecolor='k')
plot(Data[:,0], Data[:,1], 'g.')
axis('off')
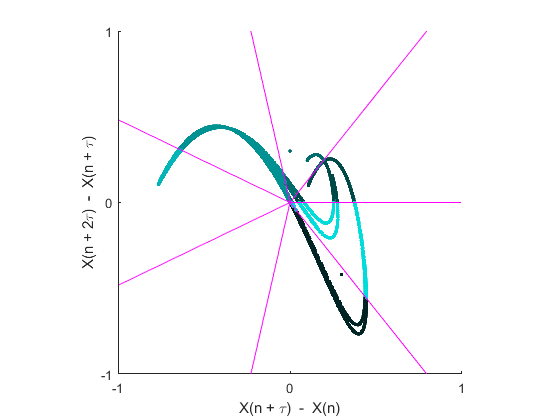
Calculate the phase entropy of the y-component in bits (logarithm base 2) without normalization using 7 angular partitions and return the second-order difference plot.
Y = Data[:,1];
Phas = EH.PhasEn(Y, K = 7, Norm = False, Logx = 2, Plotx = True)

>>> Phas
    2.0192821496913216
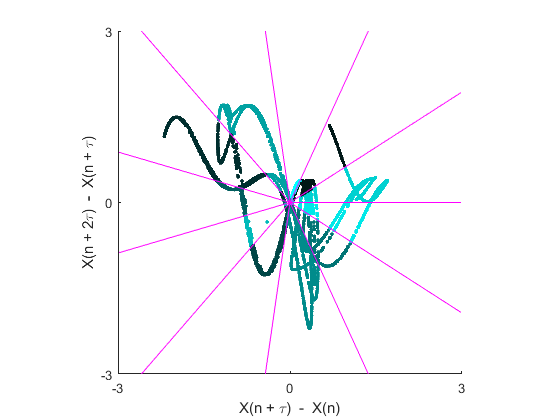
Calculate the phase entropy of the x-component using 11 angular partitions, a time delay of 2, and return the second-order difference plot.
X = Data[:,0]
Phas = EH.PhasEn(X, K = 11, tau = 2, Plotx = True)

>>> Phas
    0.8395